

Expert witness in PA gerrymandering case visits campus
Wesley Pegden, assistant professor of mathematics at Carnegie Mellon University in Pittsburgh, spoke to approximately 30 Allegheny faculty and students on Thursday, March 29, at 4 p.m. in Quigley Hall Auditorium.
Pegden’s presentation, “Using Mathematics to Detect Gerrymandering,” offered insight into his research on partisan gerrymandering — a way to manipulate district maps to favor a political party — and Markov chains, which are models used in many scientific fields to generate random samples and compare random events to an initial event.
Pegden testified before the Commonwealth Court of Pennsylvania in December as an expert witness based on his research and a January 2017 paper about Markov chains published in the Proceedings of the National Academy of Sciences. Pegden co-authored that paper with Maria Chikina of the University of Pittsburgh and Alan Frieze of Carnegie Mellon University.
“I like to explain math to people, so [testifying] was an opportunity to do that for a while,” Pegden said.
The Allegheny College Department of Mathematics hosted Pegden as part of its biannual speaker series because of the timeliness of the Pennsylvania gerrymandering issue, according to Professor of Mathematics and coordinator of the series Caryn Werner.
“What I hope faculty and the students here would learn is how math can appear in many areas, how it’s studied and how it’s applied,” Werner said.
Werner said the department contacted Pegden during the fall semester, and his visit followed legal proceedings that began in 2017.
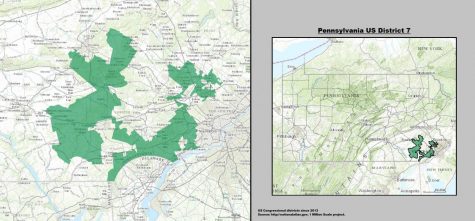
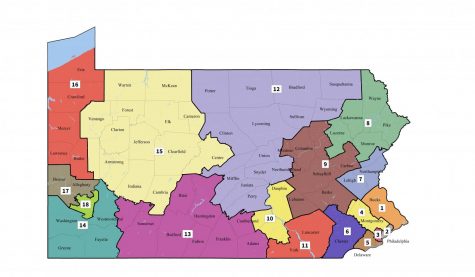
The shaded area represents the 7th Congressional District of Pennsylvania from 2013 until earlier this year. The district contained most of Delaware County and parts of Chester and Montgomery Counties. The state’s congressional districting was ruled unconstitutional by the Pennsylvania Supreme Court on Jan. 22, 2018.
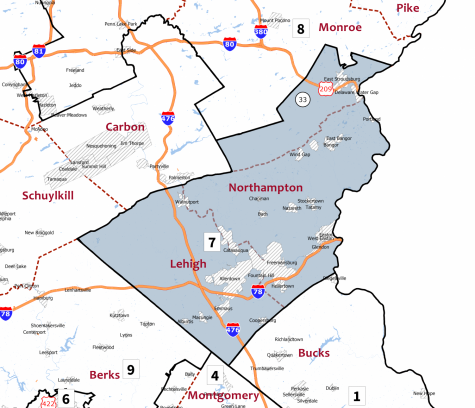
The state Supreme Court ordered a redistricting of Pennsylvania, resulting in new boundaries for the 7th Congressional District and others. The new 7th District contains most of the former 15th District and now represents Lehigh and Northampton Counties. The court released the map on Feb. 19, 2018, and the new boundaries will be in effect for the 2018 midterm elections.
A June 2017 lawsuit filed by the Pennsylvania League of Women Voters against the Commonwealth of Pennsylvania launched a movement headed by state Democrats to evaluate the state’s congressional map, which was approved in 2011.
State congressional maps are typically redrawn every 10 years based on information gathered by the United States Census Bureau. For Pennsylvania, the redistricting passed in 2011 has allowed Republicans to maintain a 13–5 advantage among the state’s 18 delegates.
Voters and legislators formally questioned that advantage in 2017 and 2018 in state and federal courts, culminating in a Jan. 22, 2018 ruling by the Pennsylvania Supreme Court that the 2011 map was unconstitutional.
The ruling required the state legislature and Gov. Tom Wolf to agree on and present a new map to the court by Feb. 15, and several groups filed map proposals.
The court did not accept those proposals and instead recruited Nathaniel Persily, a Stanford University professor of law who has experience redistricting congressional maps, to draw a new map which will be used starting with this year’s midterm elections, Pegden said.
The new map passes the Markov chain test Pegden and his colleagues have used to detect gerrymandering in state districtings.
Pegden explained the test during his March 29 presentation using an analogy involving a group of villages on an island.
A person, Pegden said, wants to arrive at a random village among a group of several villages. The person starts at one village, does not have a map of the villages and does not know how many villages are in the area.
As the person walks along roads that connect the villages, Pegden continued, eventually they will arrive at a random village, meaning the likelihood of arriving at that particular final village is equal to the likelihood of arriving at any other village.
For gerrymandering, Pegden said this means each village represents one possible districting map for a given state, and walking along the village roads represents changing one small thing about a districting map, thus arriving at a new map.
Like the number of villages, Pegden said the number of possible maps is unknown — “a gazillion,” he remarked.
“A gazillion is essentially a made up number, we have no idea how many there are,” Pegden said. “It’s definitely way more than the number of elementary particles in the universe, though.”
Arriving at a random village or map requires some time — the mixing time of a Markov chain. Mixing times are unknown for Markov chains for districting maps, but Pegden’s testing does not require knowing the mixing time because the test runs independently from mixing time.
“We get less information but in a very rigorous way,” Pegden said.
Starting with the 2011 Pennsylvania district map, Pegden and his colleagues ran a Markov chain to generate districting maps for Pennsylvania.
“For every single map in our test, we check its partisanship level with some standard metric, and then we look at how many of the districtings we encounter are as partisan as the one we started with,” Pegden said. “Our theorem gives a formula that translates our observations into statistical significance.”
Pegden and his colleagues found that taking even one step away from the 2011 map by making one small change makes the new map less partisan and considered the 2011 map an extreme outlier among possible maps.
“The lawyers on the other side in cross examination tried to make a big point of the fact that I’m not a political scientist,” Pegden said. “But the point is it doesn’t matter because the theorem tells you that no matter how your state is arranged, it’s not possible to have a state where a typical districting of the state would have partisan bias that evaporates in this consistent way that we’ve seen in our test.”
Pegden said the 2011 map is highly unlikely to be representative of a typical, or random, districting, a conclusion reflected in the Jan. 22 ruling.
Instructor of Mathematics and Biology Chris Lundberg expressed interest in understanding the likelihood of people starting to “outsmart” this test.
Lundberg said he hopes states can move beyond legislatures drawing maps and toward nonpartisan groups becoming leaders in redistricting processes.
“From a political perspective, I’ve been very interested in the gerrymandering problem, and I’ve been following the case very carefully,” Lundberg said.
During the question period following Pegden’s presentation, Lundberg asked how the test could be used to prevent people from trying to figure out “the worst map you could draw that still passes the test.”
Pegden responded by explaining more computing power would strengthen the test and increase its capacity to detect more cases of gerrymandering, especially ones that are less dramatic.
Some cases are more obvious than others and can be supported by other types of evidence as well, according to Pegden.
Other expert witnesses who testified in December presented evidence of gerrymandering based on comparing efficiency gaps and shapes of the 2011 districting to historical districtings.
Efficiency gaps are best understood by looking at how many votes are wasted by the winning party in winning districts, votes that could otherwise contribute to elections in other districts.
Shape-based evidence is perhaps most visible in the boundaries for Pennsylvania’s 7th Congressional District in the southeastern corner of the state. The former shape of the district is commonly referred to as “Goofy kicking Donald Duck.”
“Generally, this area of the state is not a particularly republican-leaning area,” Pegden said. “So when you look at this district, what looks like has happened is a few different areas that are just sort of barely republican-leaning have been patched together to create the district.”
While this type of evidence can be useful, it can be difficult to identify gerrymandering using only what can be observed from shapes and election results, Pegden argued, and being able to “rigorously quantify” gerrymandering is a more recent development in gerrymandering research.
The Markov chain test Pegden used does not describe a measure of fairness for maps, and Pegden emphasized the importance of recognizing the test’s limitations.
“Passing the test doesn’t mean that it’s fair, it means that it passed our test,” Pegden said. “I can tell you when it’s awful, but I can’t evaluate something and tell you that it’s good.”
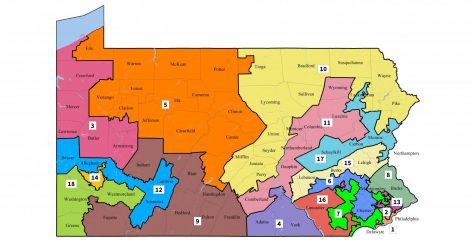
2011 Pennsylvania Congressional Districts Plan
PA Ruling Facts
Pennsylvania’s 2011 congressional districting was ruled unconstitutional by the Pennsylvania Supreme Court on Jan. 22, 2018. The new map, ordered and drawn by the state Supreme Court with the help of Stanford University Professor of Law Nathaniel Persily, features more compact districts.
Congressional district boundaries typically follow most county lines, and Crawford County, formerly represented by the 3rd District, remains in the same district, now the 16th.
Wesley Pegden, an assistant professor of mathematics at Carnegie Mellon University, testified before the Commonwealth Court of Pennsylvania in December, explaining how he and his colleagues have used Markov chains and probability to detect gerrymandering.
Other expert witnesses included Nolan McCarty, Princeton University professor of politics and public affairs, Wendy Tam Cho, University of Illinois professor of political science and statistics, and John Kennedy, West Chester University professor of political science.
Expert reports and other case documents available here.